Charts Show up our Static
The Chart section in a database is a dedicated tool for data visualization.
Through graphical representations, it intuitively and clearly displays various data volumes in the database.Feature not only helps users quickly understand the distribution and trends of complex data but also reveals relationships and patterns among the data.
Short, the charts in the Chart section are designed to enhance users' ability to gain insights into data, aid decision-making, and make data analysis more
Bar Chart of Data Based on Time
Nanoparticles' Examples
Au Nanoparticle Diagram is an Example
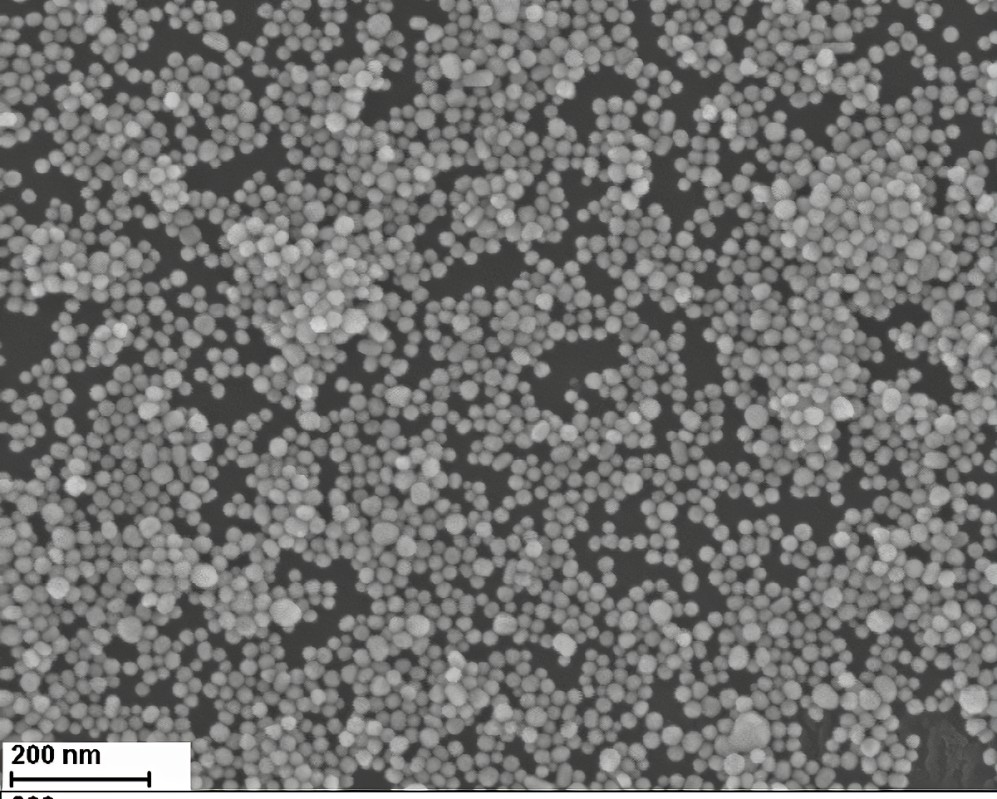
Ag Nanoparticle Diagram is an Example
.gif)
.gif)
Fe3O4 Nanoparticle Diagram is an Example